Colour Context as Chords
In my previous post, I introduced my system for mapping colour and pitch to visually communicate musical intervals. If you haven’t read it yet, I recommend reading it now!
In this post, I want to explore how we can build on the current system by creating combinations of colours to represent musical chords. To do this, I will utilise the concept of an optical mixture. This phenomenon occurs when two or more colours, viewed simultaneously, are perceived as a blended hue. Pointillist and Impressionist artists such as Georges Seurat and Claude Monet used this effect by layering, or placing side by side, dots or brushstrokes so the viewer’s eye would mix them into a new hue, rather than the painter. This technique is comparable to the way musical pitches combine to form chords. A selection of notes are played at one time, but no single pitch dominates – all contribute to create a new harmonic identity.
Chords and colour combinations sound consonant or dissonant depending on how their elements interact. In Western harmony, consonant chords (e.g., major and minor triads) contain intervals that we associate with blending well, while dissonant chords (e.g., the diminished 7th) create tension through audible beating between pitches. In colour theory, complementary pairs (e.g., red and green) can create high visual tension through a strong contrast between hues; conversely, closely related pairs such as blue and blue-green tend to blend or accentuate their hue qualities, as the difference between the two colours is minimally noticeable. I intend to explore how we can use these musical relationships, with their corresponding colour assignments in the system, to create optical mixtures of chords that communicate their inherent intervallic structure.
Conceptual Limitations
Relativity of Colour Perception
Approaching this topic involves considerable ambiguity. Colour is inherently contextual and is never perceived in isolation but always in relation to its surroundings. The same applies to music: while individual pitches can be heard separately, we usually experience them in relation to others. People have different musical experiences and backgrounds; as such, the system and design are more relational than purely symbolic. No scientific proof shows a fixed perceptual link between specific colours and ideas, and the ideas discussed are simply that: ideas. While similarities exist, nothing is definitive. Colour, like harmony, only truly manifests in contrast and context. This ambiguity can be a strength or a limitation: it offers many opportunities for creative exploration, but it also suggests that visualisations alone may not suffice for understanding. Interaction could also play a role in communicating the system and approach.
No Direct One-to-One Mapping
Music is difficult to apply a universal system to due to its diverse cultural approaches and varied uses. Harmony is influenced by enculturation – our concepts of diatonic and chromatic movement may not be relevant when discussing other cultural musical styles. This work applies solely to the Western music tradition. Viewers will likely bring their own cultural and emotional associations to this mapped system, so it is also essential to emphasise its relativity and that it is not empirically fixed. A useful approach to this design might be to treat it as a harmonic visual grammar, where colours behave like intervals but don’t directly represent them.
Pixel Grid Experiments
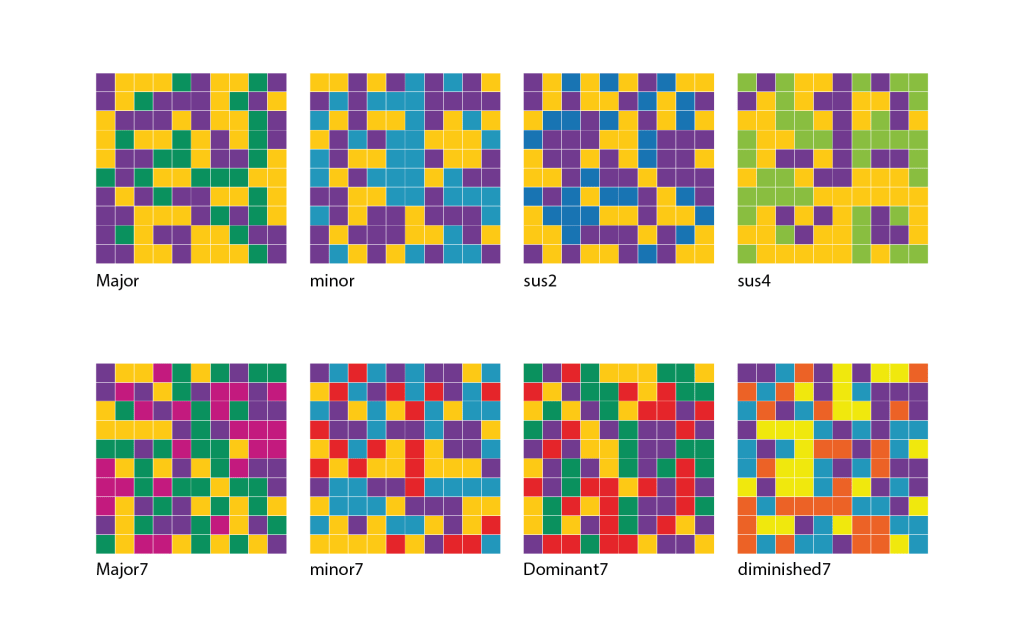
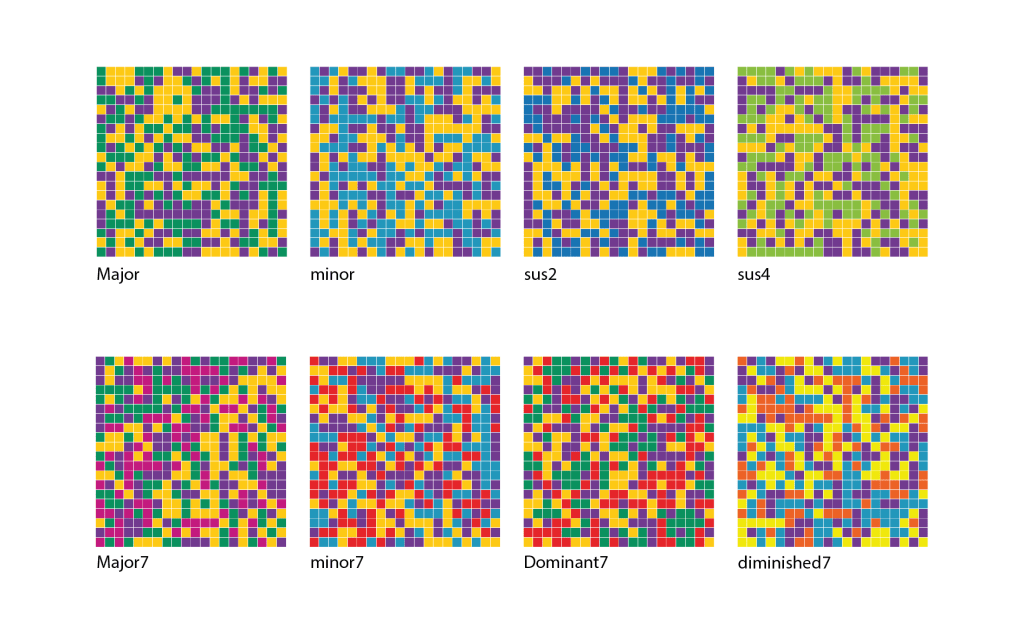
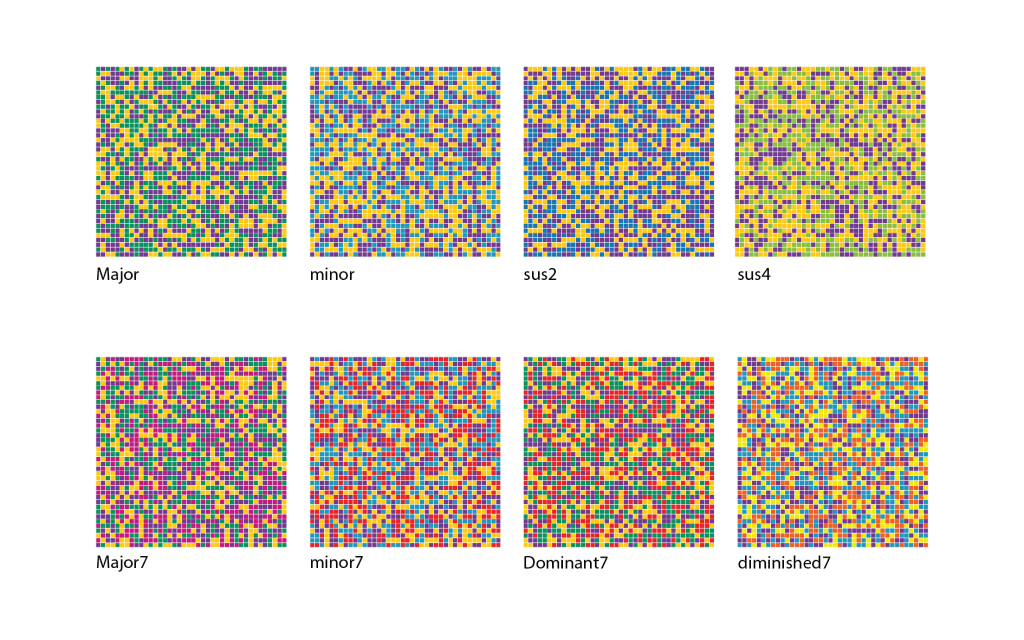
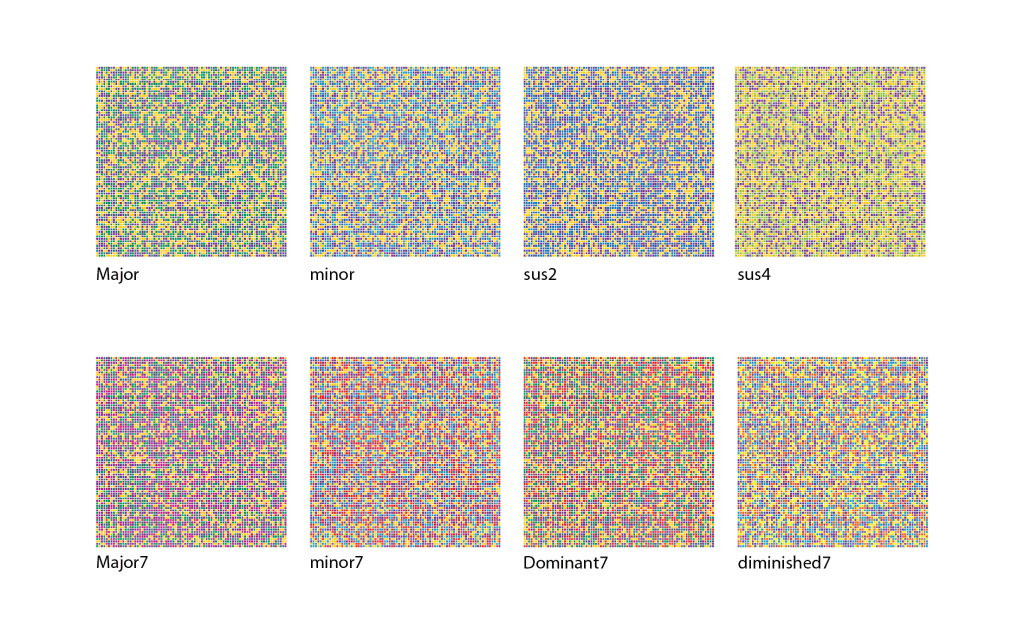
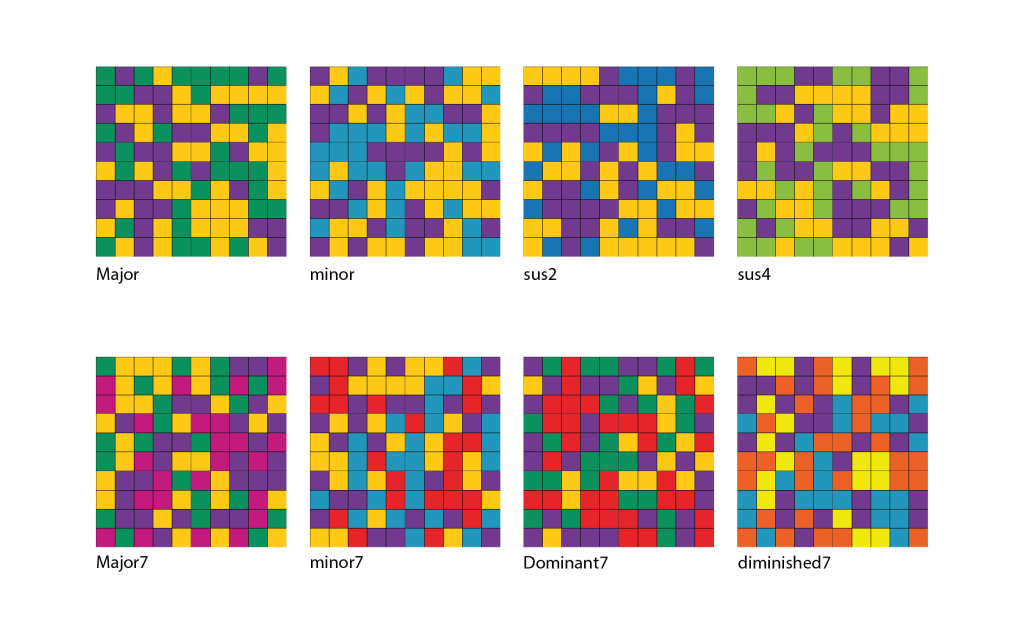
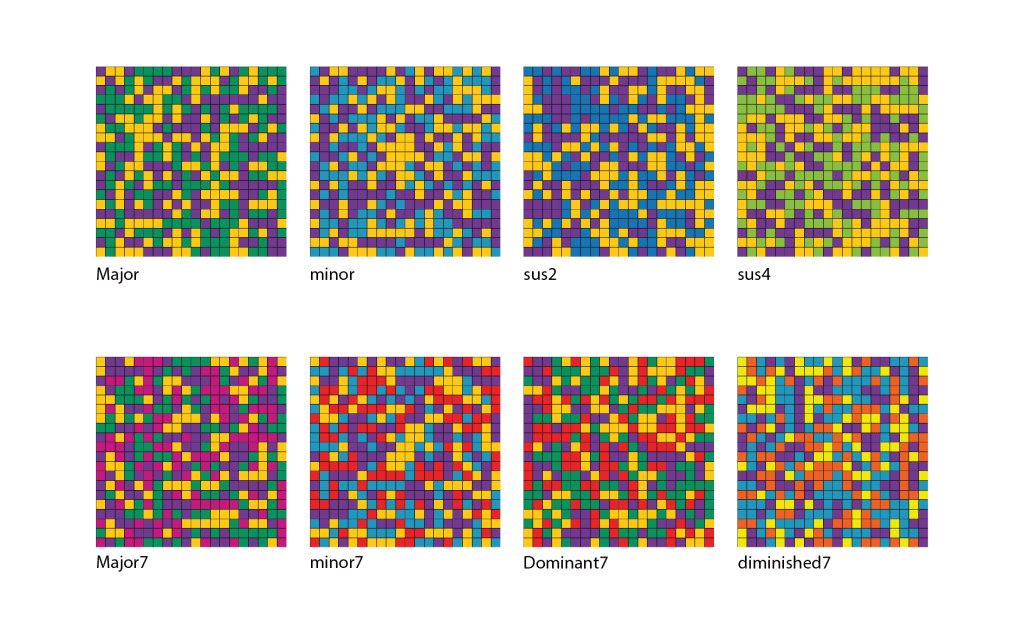
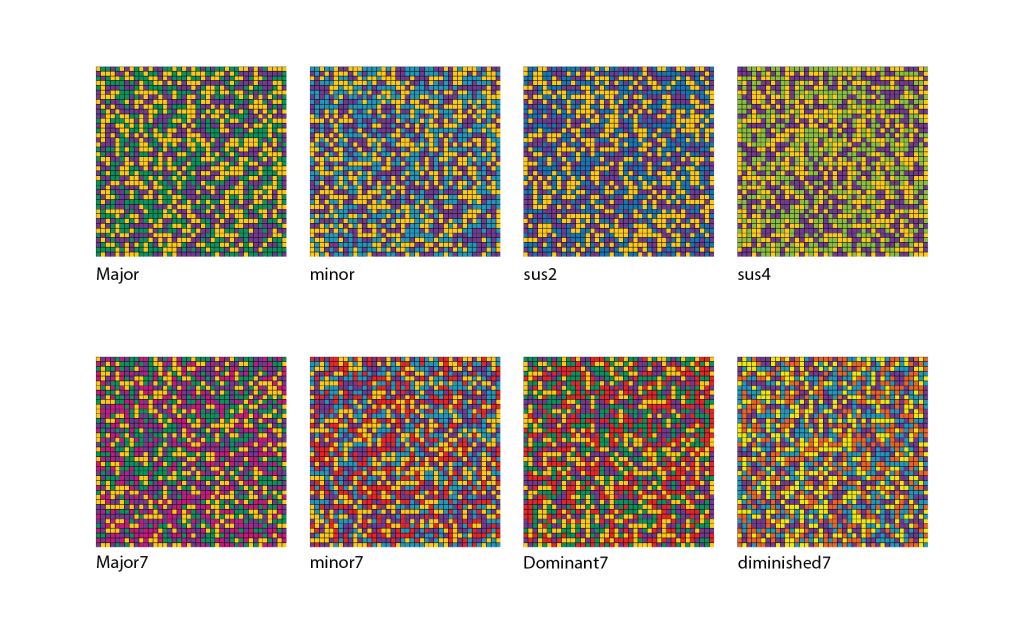
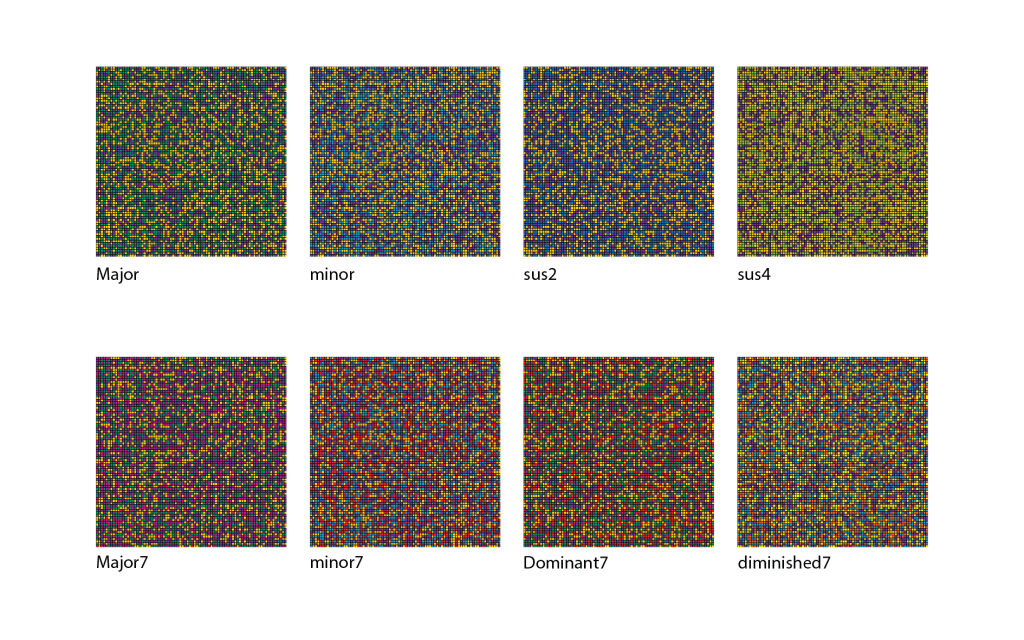
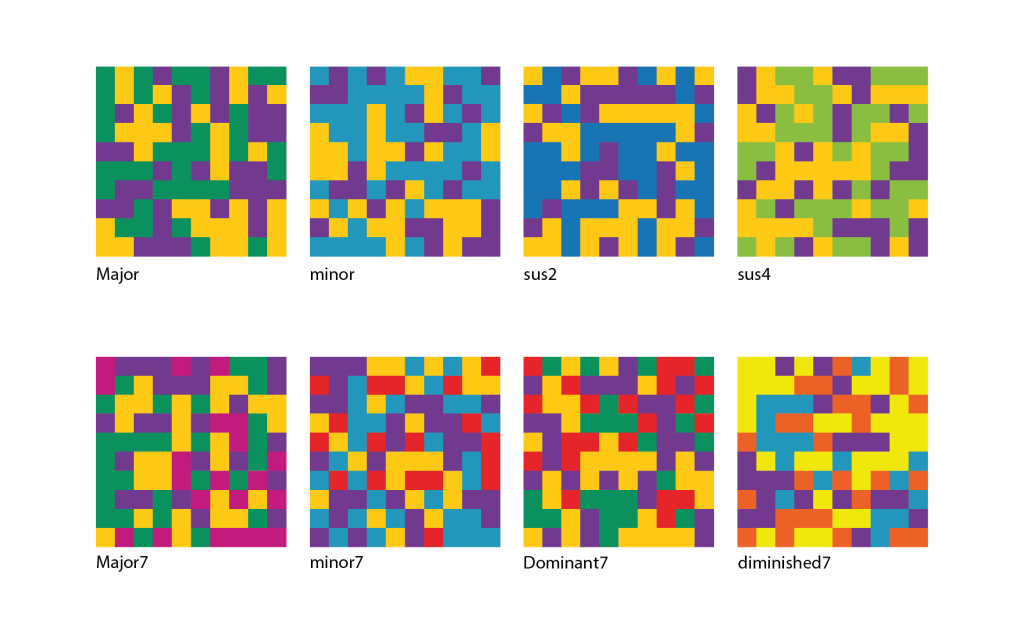
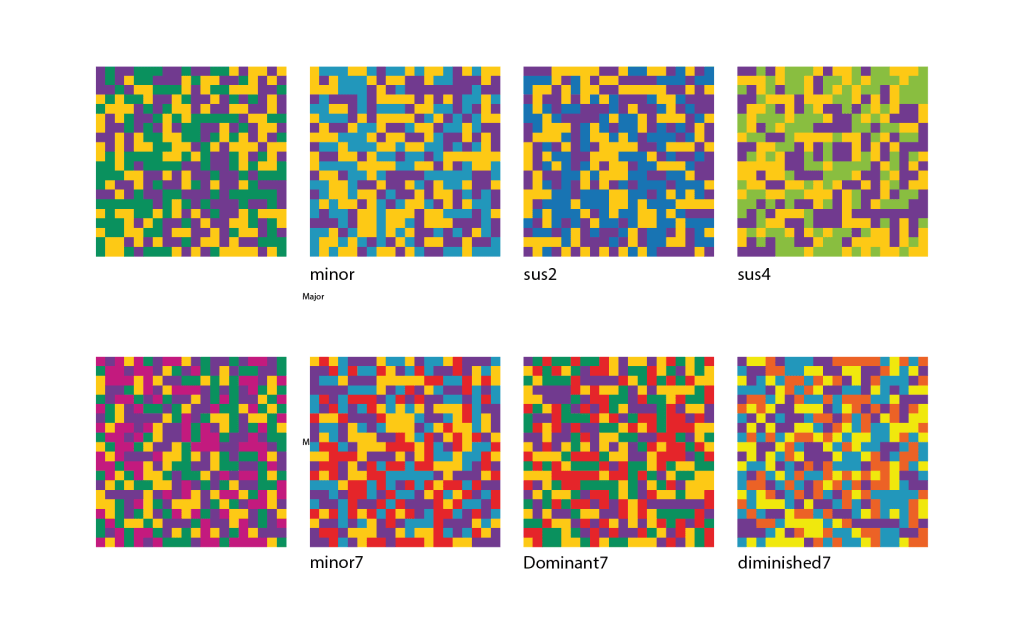
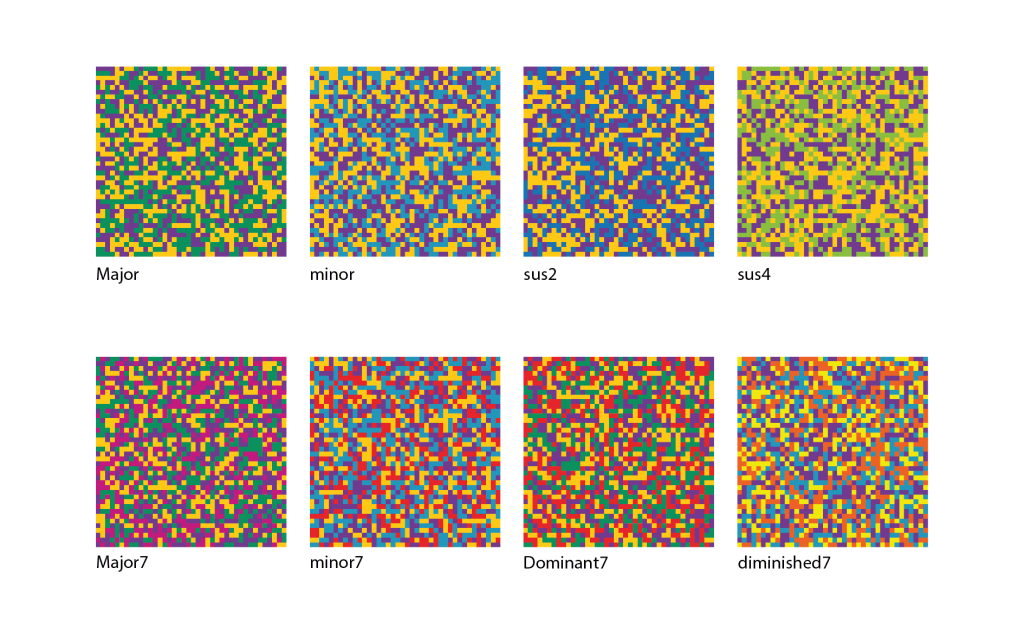
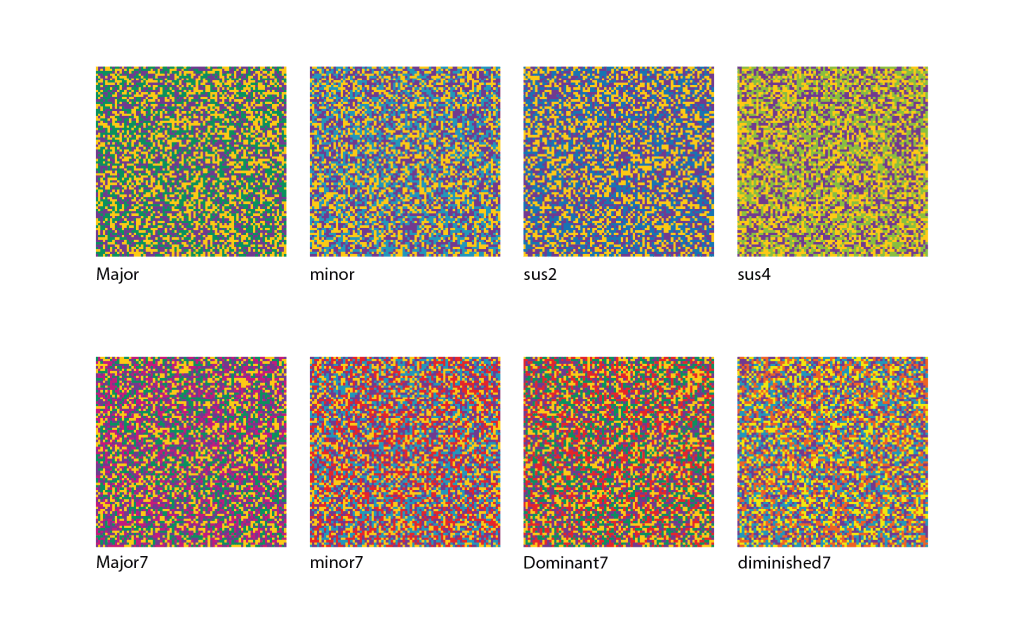
Below are several pixel grid experiments exploring the visualisation of different chordal structures. Each grid is generated using specific scale degrees associated with the colour palette that form each chord, then randomly arranged into grid arrays. Created in Processing, each grid is formed by selecting the chord’s colour relationships. The represented chords include four triads: major, minor, suspended 2nd, and suspended 4th; and four types of tetrads: major7th, minor7th, dominant7th, and diminished 7th. These grid arrays are further developed by varying parameters such as stroke colour/no stroke and grid pixel size to assess how these aspects influence perception and interpretation
Discussion
Grid Resolution
Four types of grids, ranging from low to high density, are shown above: 10×10, 20×20, 40×40, and 80×80. As pixel density increases, so does the visual density. In the low-pixel-density examples, it is easier to distinguish the different harmonic colour palettes. Larger grids with higher pixel and visual density offer a more complex translation, providing a visualisation that more closely aligns with the definition of an optical mixture and creates a more homogeneous colour texture. However, this makes it harder to decipher individual coloured cells and conveys something different from a 10×10 or even 20×20 grid. A consideration is needed for the balance between clarity and complexity. Does a higher-pixelated grid improve clarity, or does its visual complexity overwhelm the viewer? The purpose of these visualisations is to provide an interpretable representation. Higher pixel density may shift the emphasis to purely experiencing a visual texture and form of abstraction rather than conveying specific intervallic relationships visually.
Stroke Variation
Aside from grid resolution, there are three border options to consider. The first two – white and black – create visible boundaries that separate the cells. The third option, no border, allows cells to blend and form different shapes within the grid. Without these boundaries, the grid and chord can appear as a unified whole rather than multiple cells, closely resembling an optical mixture. However, one could argue that, although notes combine to produce something new, they still retain their individual qualities. This point has also been discussed when considering how we physically process pitch in the inner ear. When we hear, a specific part of the basilar membrane vibrates in response to a particular frequency. Therefore, when hearing two pitches simultaneously, two sections of the membrane vibrate according to the two frequencies . Although they are perceived together, the brain processes these two frequencies separately and never fully merges them (Helmholtz, 1954, 146). In line with this theory, should this visualisation keep separate colours throughout, acknowledging that although we are hearing one sound of combined pitches, each pitch retains its own characteristics?
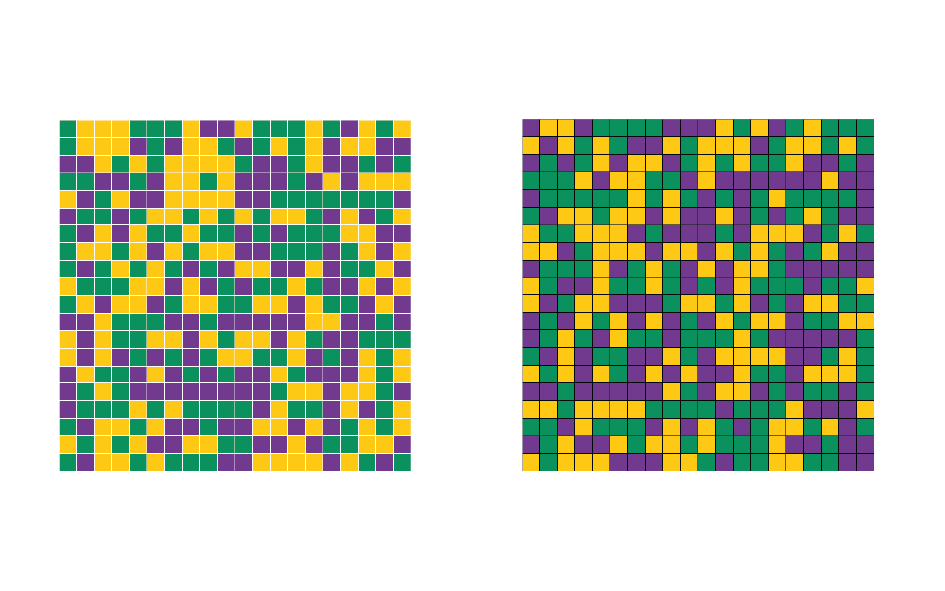
Another aspect to explore in the discussion on stroke is the influence on how we perceive and interpret hue qualities. Grids lacking strokes most accurately demonstrate optical mixing. However, when white and black are used to outline each cell, the simultaneous contrast theory – specifically, the light-dark contrast theory – becomes relevant. This theory suggests that the same colour can appear lighter or darker depending on the surrounding context. This leads me to think about the Bezold Effect, which recognises that the visual effect of colour sequences can be altered entirely by changing just one colour (Albers, 2022, 33). As seen below, the CMYK values of the colours used in both examples are the same; however, the two different outlines have a marked impact on the visual effect of the two grids. Black outlines tend to darken all colours, while white outlines help hues stand out and appear brighter. As a result, tones may seem warm or cool not only because of neighbouring colours, but also because of their cell outlines. An interesting question to ponder here is whether these different outlines will influence the viewer’s interpretation of what they are seeing and/or hearing.
Chord Types
Using the colour palette, each chord type, when arranged in this grid, exhibits unique visual qualities influenced by its intervallic structure. This setup creates a grid that arguably reflects each chord’s structural function through its visual impact. Our major and minor triads, along with major7th and minor7th tetrads, embody balance, symmetry, and stability as their hues are evenly distributed across the palette without any single hue dominating. Sus2 and sus4 chords evoke a more open spatiality due to their close intervallic makeup – sus2 features a major 2nd after the tonic, while sus4 has a major2nd before the dominant. This focus on closely related hues is heightened by the space between the tonic and the dominant, conveying suspension and unresolved tension. The dominant7th chord, while balanced like the major, introduces more contrast because of its prominent minor 7th interval. The contrast between the green (major 3rd) and red (minor 7th) creates greater visual emphasis and a stronger need for resolution, as these two colours are complementary. This contrast mirrors its role in creating sonic tension and resolution during cadences and modulation. The diminished7th, although the most dissonant chord, is the most spatially symmetrical. The interval grid is densely packed, with all four hues equally close, creating high visual tension that reflects its auditory dissonance. Both our dominant and diminished chords follow the theory of simultaneous contrast, where contrasting hues amplify each other’s intensity, echoing their sonic pull to resolve.
Generative Aesthetics
In the programme, randomness introduces variation in each visualisation, preventing static interpretation. This creative choice reflects music’s inherent nature. Musically, its impact can vary and be influenced by numerous factors. Even if chords retain the same pitches, they can sound different each time, in different positions, and serve different functions depending on the musical context. The grid format provides order, while randomness adds a sense of flux and indeterminacy.
Conclusion…
These optical mixtures are an exploration into representing mutliple colours at one time, to form a whole; in the same way multiple notes form a chord. They should not be seen as direct translations of harmony, but instead be seen as a visual grammer representing the relationality of how pitches interact through the use of colour. In their multitude of variations, these visualisations show that there different ways of representing these chordal relationships through grid density and outline variations which significantly alter how the colour combinations, and subsequently the chord, is percieved. This raises the importance of how the way something is visually communicated can alter or change interpretation and understanding. Besides what I have already discussed, there are some further important questions that I believe need consideration:
- When does harmonic representation turn into visual noise?
- Is there a need to find balance between musical information and visual abstraction?
- What are the potential forms these visualisations could develop into- could they evolve into independent visual artworks, coded compositions, or live dynamic visuals?
- How can these grids be incorporated into playing and listening to enhance understanding?
Moving forward, I want to explore how this way of visualising multiple pitches can be integrated into visualising existing musical works, as well as look at how understanding can be deepend through inviting users to interact with the system.
Watch this space!
Sources
Albers, Josef. Interaction of Color. 50th Anniversary Edition (New Haven, Connecticut: Yale University Press, 2022)
Helmholtz, H. v., and Ellis, A. J., On the Sensations of Tone as a Physiological Basis for the Theory of Music. Second English edition / Translated, Thoroughly revised and Corrected, Rendered conformable to the fourth (and last) German edition of 1877, with Numerous additional notes and a New additional appendix bringing down information to 1885, and Especially adapted to the use of musical students, by Alexander J. Ellis with a new introduction (1954) by Henry Margenau (New York: Dover Publications, 1954) p.146.


Leave a Reply